
We have released a new Dashboard in your IntelliBrand console which gives you an instant, interactive view of your revenue, top customers, rep performance and product insights — updated nightly and ready to explore with a single click.
What’s included
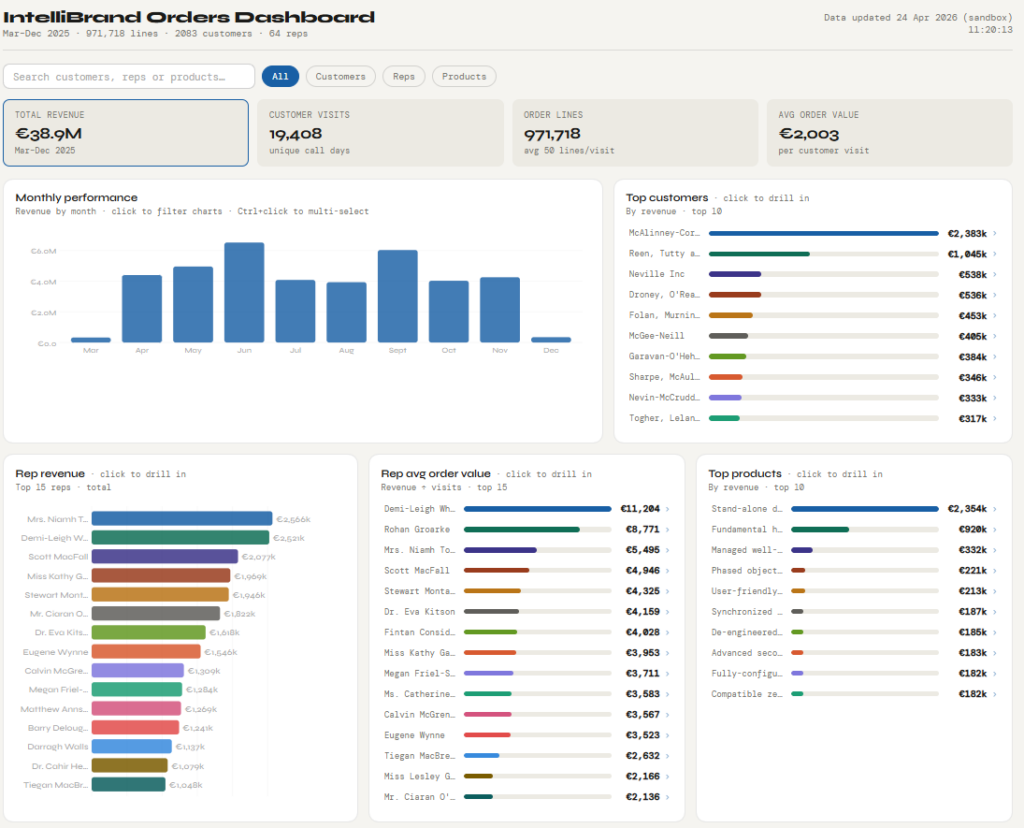
| Monthly Revenue Trends See revenue, order lines, customer visits and average order value at a glance. Click any month to filter all charts to that period — or Ctrl+click to compare multiple months side by side. |
| Customer Deep-Dives Click any customer to see their full revenue history by month, the products they buy most, and their visit patterns. |
| Rep Performance & Rankings Revenue and average order value for every rep, ranked and visualised. Drill into any rep to see their top customers and month-by-month performance history. |
| Product Insights Your top-performing products ranked by revenue, with monthly trends and a view of which customers are driving each product’s sales. Spot what’s growing — and what needs attention. |
Accessing the Dashboard:
Simply go to Reports/Orders on your IntelliBrand Console and click on the Dashboard report. It loads automatically with your live data.
As always, if you have any suggestions on how to improve IntelliBrand, please email us at info@wasptech.com
Also, we would love a rating for InteliBrand in the Play Store . . click link to rate:
https://play.google.com/store/apps/details?id=com.wasptech.intellidroid&hl=en_IE